
Market Update | February 2024
Cautious Market Optimism as Seasonal Changes Take Shape
Published on: March 5, 2024
Northwest MLS, the source for the most current, accurate market listing data in Washington state, today released its Market Snapshot for the month of January 2024.
Market Recap
The real estate market has remained slow in accordance with typical seasonal patterns, with expected increases in activity as winter transitions into spring. Interest rates have increased by a quarter percent over the past month to 6.94%, continuing to inhibit prospective buyers’ purchasing power as well as prospective sellers’ willingness to give up low rate mortgages. For the Washington counties covered by NWMLS, February 2024 saw a nearly 2% decrease in closed sales transactions year-over-year, although median prices have continued to rise with a year-over-year increase of nearly 6%.
Important takeaways from February’s data:
The median sales price of homes increased in 19 out of 26 counties and decreased in 7 counties relative to February 2023. The three counties with the highest median sale prices were King ($820,000), Snohomish ($715,000) and San Juan ($671,000). The three counties with the lowest median sale prices were Grant ($300,425), Pacific ($236,025) and Columbia ($174,500).
The number of homes on the market increased throughout Washington with 17 out of 26 counties seeing a year-over-year increase. Overall, there was a nearly 4% year-over-year increase in active property listings in Washington counties covered by NWMLS.
Ten of the 26 counties included in the report saw an increase in the number of homes sold year-over-year, while 14 counties saw a decrease in the number of homes sold year-over-year. Two counties, King and Pacific, saw relatively no change in the number of year-over-year sales transactions.
Condominium sales continue to show strong growth throughout the NWMLS service areas, with 636 units sold in February 2024, which is a year-over-year increase of more than 9%. The median sale price of condominiums increased more than 15% year-over-year, from $430,000 at the end of February 2023 to $496,500 in February 2024.
“Although seller reluctance has continued to stifle inventory levels, year-over-year inventory levels have improved slightly – an increase of 4% – relative to February 2023,” said Mason Virant, associate director of the Washington Center for Real Estate Research at The University of Washington. “Despite the year-over-year transaction volume decline of 2% over February 2023, low levels of for-sale inventory have led to increased competition amongst buyers, producing a nearly 6% year-over-year increase in median home prices across the Washington counties covered by NWMLS.”
Active Listings
There were 7,495 active listings on the market at the end of February 2024, an increase of nearly 4% compared to February 2023 (7,234). The volume of homes on the market increased throughout Washington with 17 out of 26 counties seeing a year-over-year increase – select a county in the chart below to view the available inventory counts in a particular county:

Year Over Year Active Listings
Island, King and Snohomish County

New Listings
NWMLS brokers added 6,513 new listings to the database in February 2024, an increase of nearly 25% compared to February 2023, when 5,231 new listings were added. The number of new listings added in King County increased more than 33% year-over-year. Select a county in the chart below to view the number of new listings added in any county:

Pending Sales
There were 5,945 total residential units & condo units under contract in February 2024, a decrease of 4.57% when compared to February 2023 (6,230).
Despite the overall decrease, there were 11 counties that had a year-over-year increase in the number of pending sales, in Okanogan (+35.29%), Kittitas (+34.04%), Adams (+33.33%), Douglas (+29.17%), Chelan (+23.4%), Columbia (12.5%), Clallam (+8.96%), Walla Walla (+7.84%), Clark (+4.41%), King (+3.78%), and Kitsap (+1.86%) counties. Select a county in the chart below to view the pending sales within a specific county:

Closed Sales
February 2024 saw a 1.62% decrease in closed sales transactions year-over-year. The total dollar value of closed sales for residential homes for this month was $2,772,859,503 and was $$388,894,799 for condominiums.
Despite the nearly 2% decrease overall, there were 10 counties with a year-over-year increase in the number of closed sales, including Jefferson (+70.59%), Adams (+33.33%), Okanogan (+33.33%), Chelan (+21.88%), Kittitas (+14.29%), Walla Walla (+12.5%), Whatcom (+7.48%), Clark (+6.82%), Mason (+4.84%), Clallam (+4.55%). The number of year-over-year closed sales in King and Pacific counties remained unchanged. Select a county from the chart below to view the number of closed sales:

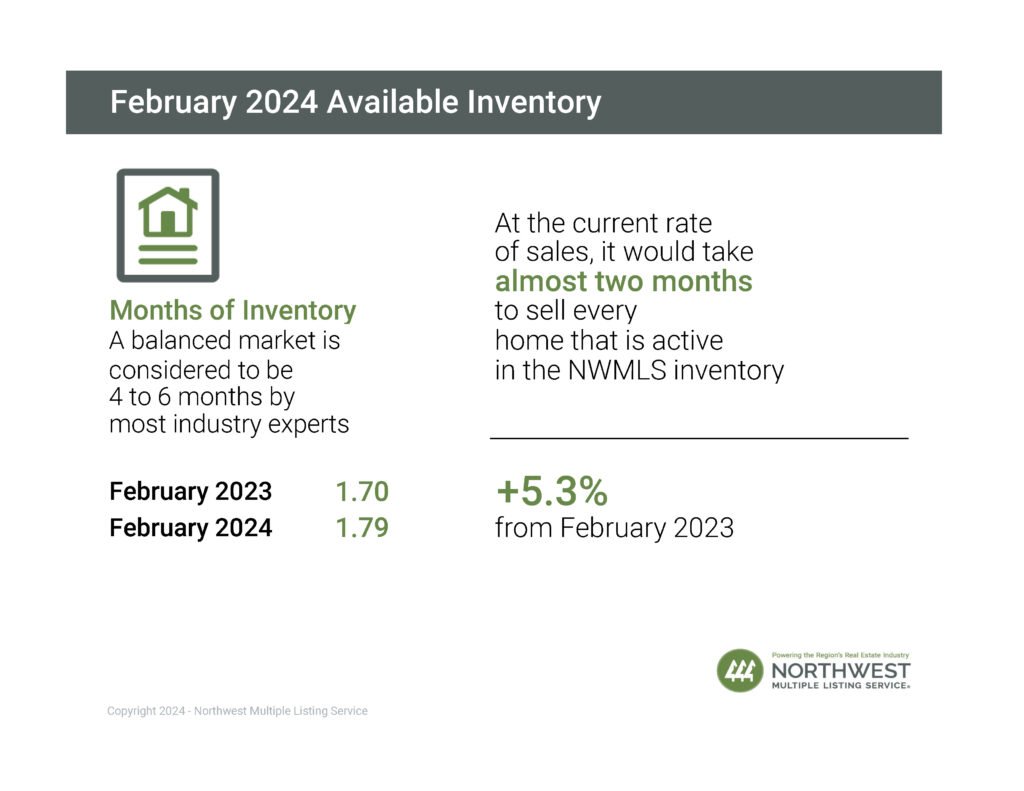
Months of Inventory
A balanced market is considered to be 4 to 6 months by most industry experts. At the current rate of sales, it would take less than two months to sell every home that is active in the NWMLS inventory. The four counties with the lowest months of inventory in February 2024 were Snohomish (0.88), King (1.47), Pierce (1.60), and Thurston (1.71).
Year Over Year Months of Inventory
Island, King, and Snohomish County

Median Price
Overall, the median price for residential homes and condominiums sold in February 2024 was $608,111, up nearly 6% when compared to February 2023 ($575,000). The median sales price increased year-over-year in 19 of the 26 counties, with the highest median sales prices in King ($820,000), Snohomish ($715,000), and San Juan ($671,000) counties. Select a county from the chart below to view its median sales price:

