
Market Update | June 2025
Available Inventory in all NWMLS Areas Experiences Highest Growth Since 2022
Published July 3, 2025 | Courtesy of NWMLS
Market Recap
Inflation and unemployment concerns prompted the Federal Reserve to maintain the federal funds rate at its current level, “giving a general indication of trends that may affect mortgage rates,” said Steven Bourassa, director of the Washington Center for Real Estate Research (WCRER). Mortgage rates remain stubbornly high at 6.77%, making affordability a challenge for prospective buyers. “The continued anticipation of inflation and concerns about increasing government debt suggests that mortgage interest rates are not likely to go down any time soon,” continued Bourassa.
However, June did show some positive signs for future buyers. The number of active listings reached 19,837, marking the first time since September 2022 that all 27 counties in the NWMLS service area experienced double-digit, year-over-year increases in inventory. In addition, the median home price remained relatively stable from May 2025 (increasing 1.52% from $660,000 to $670,000 in June 2025) and increased just 3.08% year-over-year from June 2024’s median price of $650,000.
Selma Hepp of Cotality indicated that though mortgage rates may be daunting, the “increase in the availability of homes for sale and the softening of home prices” indicates the NWMLS service area “is experiencing a re-balancing of housing market trends.”
“As prices moderate, opportunities open up for buyers who have been priced out, which may help stabilize the home market,” continued Hepp.

Active Listings
There was a 38.82% increase in total number of properties listed for sale year-over-year, with 19,837 active listings on the market at the end of June 2025, compared to 14,393 at the end of June 2024. When compared to the previous month, active inventory increased by 1,527 listings (+8.34%), up from 18,310 in May 2025.
The number of homes for sale year-over-year increased throughout the NWMLS coverage area, with 27 out of 27 counties seeing a double-digit year-over-year increase, marking the first time since September 2022 that all counties in NWMLS service area experienced double-digit year-over-year increases in active listings. The six counties with highest year-over-year increases in active inventory for sale were Columbia (+70%), Grant (+61.59%), Snohomish (+50.96%), Whatcom (+49.02%), King (+46.69%), and Adams (+46.51%).

Year Over Year Active Listings
Island, King and Snohomish County

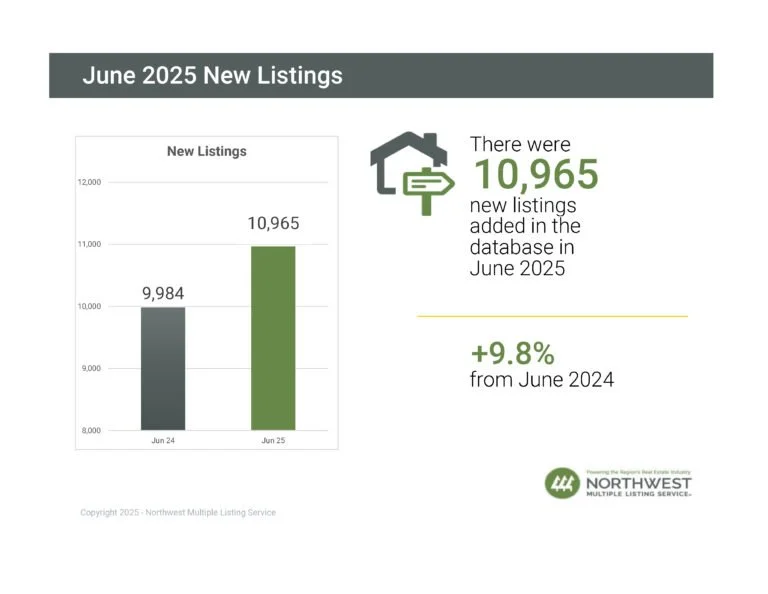
New Listings
NWMLS brokers added 10,965 new listings to the database in June 2025, a year-over-year increase of 9.83% compared to June 2024 (9,984). When compared to the previous month (May 2025), new listings decreased by 16.48%, when 13,129 listings were added to the NWMLS database.
The number of new listings increased year-over-year in 20 of 27 counties. The six counties with the largest year-over-year increases were Ferry (+80%), Clark (+33.33%), Chelan (+27.48%), Wahkiakum (+25%), Okanogan (+21.62%), and Whatcom (+20.1%).
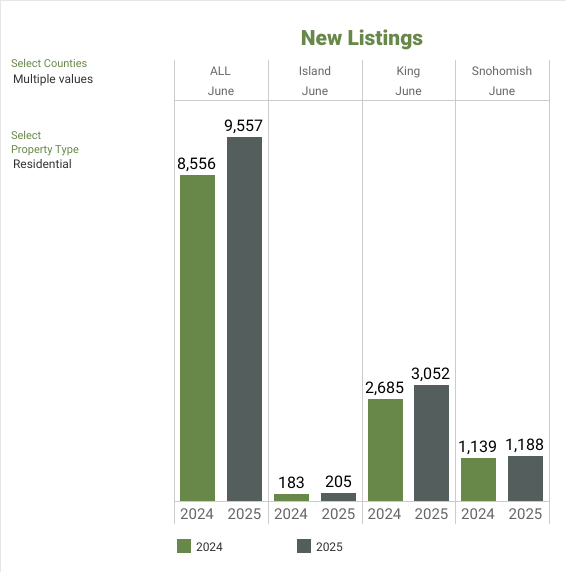
Year Over Year New Listings
Island, King and Snohomish County
Pending Sales
There were 7,801 residential units & condo units under contract in June 2025, an increase of 1.97% when compared to June 2024 (7,650). When compared to the previous month, the number of pending listings decreased by 5.43%, down from 8,249 listings under contract in May 2025.

Closed Sales
The number of closed sales decreased by 1.01% year-over-year (6,694 in June 2025 compared to 6,627 in June 2024). When compared to the previous month, the number of closed sales increased by 3.51%, up from 6,467 sales in May 2025.
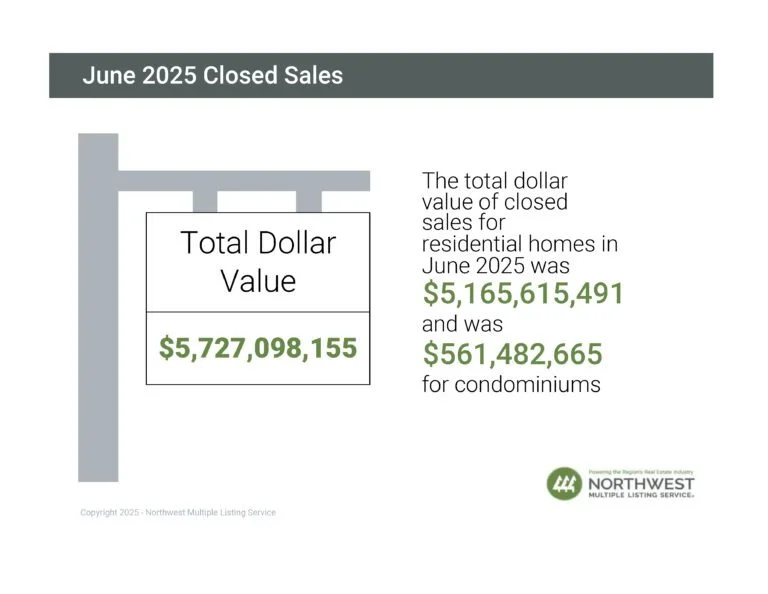
13 out of 27 counties saw an increase in the number of closed sales year-over-year. The six counties with the largest increases were Adams (+55.56%), Columbia (+33.33%), Lewis (+29.73%), Kittitas (+17.53%), Douglas (+10.87%), and Mason (+7.37%). The total dollar value of closed sales in June 2025 for residential homes was $5,165,615,491 and was $561,482,665 for condominiums ($5,727,098,155 in total).
Months of Inventory
A balanced market is considered to be 4 to 6 months by most industry experts. At the current rate of sales, it would take a little less than 3 months (2.96) to sell every home that is active in the NWMLS inventory. The six counties with the lowest months of inventory in June 2025 were: Kitsap (2.05), Snohomish (2.12), Thurston (2.19), Pierce (2.65), King (2.72) and Skagit (2.9).

Year Over Year Months of Inventory
Island, King, and Snohomish County

Median Price
Overall, the median price for residential homes and condominiums sold in June 2025 was $670,000, a slight increase of 3.08% when compared to June 2024 ($650,000). When compared to last month, the median price increased 1.52%, up from $660,000 in May 2025.
The three counties with the highest median sale prices were San Juan ($1,035,000), King ($913,563), and Snohomish ($775,000), and the three counties with the lowest median sale prices were Columbia ($275,000), Adams ($320,000), and Ferry ($340,000).

