Market Update | July 2025
Market Holds Stead as High Mortgage Rate Persists
Published August 5, 2025 | Courtesy of NWMLS
Market Recap
At the end of July 2025, the 30-year fixed mortgage rate was 6.72%, virtually the same as the average rate over the past year. As a consequence, home sales remain sluggish with only a 3.81% increase in transactions over July 2024. The growth in listings relative to a year earlier was much greater at 37.42%. Meanwhile, median prices remained consistent with July 2024 prices.

Active Listings
There was a 37.42% increase in total number of properties listed for sale year-over-year, with 20,781 active listings on the market at the end of July 2025, compared to 15,122 at the end of July 2024. When compared to the previous month, active inventory increased by 944 listings (+4.76%), up from 19,837 in June 2025.
The number of homes for sale year-over-year increased throughout the NWMLS coverage area, with 26 out of 27 counties seeing a double-digit year-over-year increase (all counties except Okanogan, which increased by 8.7%). The six counties with highest year-over-year increases in active inventory for sale were Ferry (+60%), Snohomish (+53.56%), Clallam (+52.91%), Columbia (+52.17%), Thurston (+46.86%), and Grant (+44.51%).

Year Over Year Active Listings
Island, King and Snohomish County

New Listings
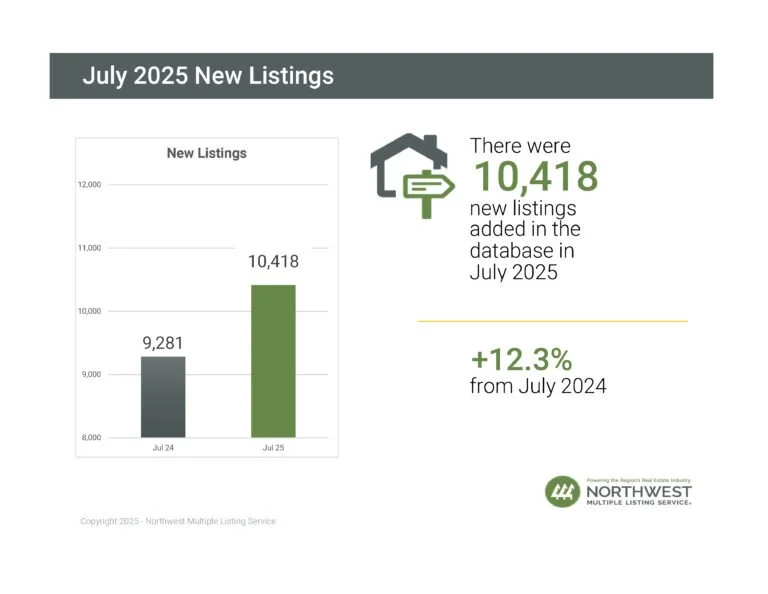
NWMLS brokers added 10,418 new listings to the database in July 2025, a year-over-year increase of 12.25% compared to July 2024 (9,281). When compared to the previous month (June 2025), new listings decreased by 4.99%, when 10,965 listings were added to the NWMLS database.
The number of new listings increased year-over-year in 23 of 27 counties. The six counties with the largest year-over-year increases were Clallam (+55.96%), Ferry (+50%), Island (+27.27%), Jefferson (+26.56%), Thurston (+26.25%), and Lewis (+26.02%).
Year Over Year New Listings
Island, King and Snohomish County

Pending Sales
There were 7,764 residential units & condo units under contract in July 2025, an increase of 2.08% when compared to July 2024 (7,606). When compared to the previous month, the number of pending listings decreased by 0.47%, down from 7,801 listings under contract in June 2025.

Closed Sales
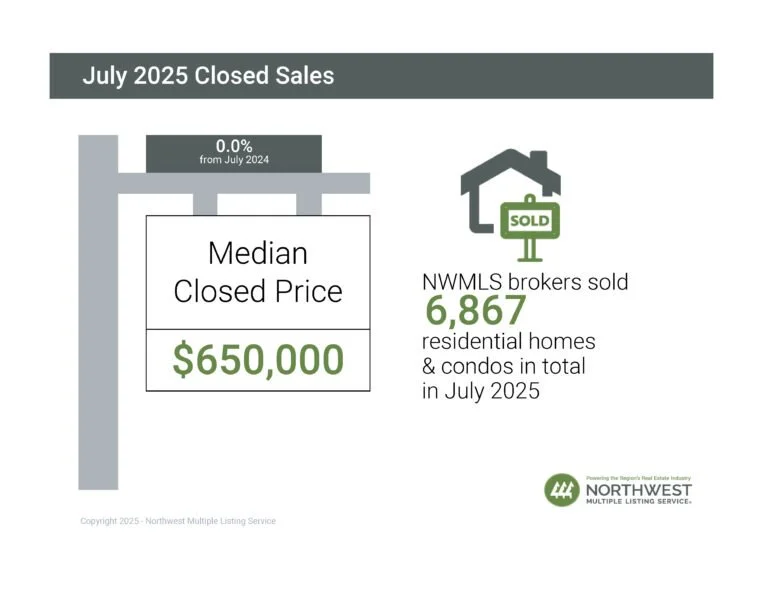
The number of closed sales increased by 3.81% year-over-year (6,867 in July 2025 compared to 6,615 in July 2024). When compared to the previous month, the number of closed sales increased by 2.58%, up from 6,694 sales in June 2025.
19 out of 27 counties saw an increase in the number of closed sales year-over-year. The six counties with the largest increases were San Juan (+100%), Adams (+75%), Pacific (+71.43%), Ferry (+66.67%), Clallam (+47.56%), and Grant (+30%). The total dollar value of closed sales in July 2025 for residential homes was $5,174,046,115 and was $517,348,303 for condominiums ($5,691,394,418 in total).

Months of Inventory
A balanced market is considered to be 4 to 6 months by most industry experts. At the current rate of sales, it would take around 3 months (2.03) to sell every home that is active in the NWMLS inventory. The six counties with the lowest months of inventory in July 2025 were: Kitsap (2.29), Snohomish (2.32), Thurston (2.49), Pierce (2.60), King (2.76) and Clallam (2.82).

Year Over Year Months of Inventory
Island, King, and Snohomish County

Median Price
The median sales price for residential homes and condominiums sold in July 2025 was $650,000 — unchanged from July 2024. Compared to the previous month, the median price declined 2.99%, down from $670,000 in June 2025.
The three counties with the highest median sale prices were San Juan ($906,250), King ($875,000), and Snohomish ($765,000), and the three counties with the lowest median sale prices were Columbia ($257,250), Ferry ($275,000), and Adams ($349,999).